Over the past 50 years, the world market of mineral fertilizers has increased almost 5 times and its volume reaches more than $ 70 billion. Its development has a stable progressive nature without significant recessions, which is caused by such factors as a reduction in the resource of free world sown areas, an increase in the world population, an increase requirements for product quality, penetration of agricultural products into the energy market. All this requires increased returns from farmland and entails growing consumption of all types of fertilizers.
The volume of world production of mineral fertilizers in 2007 was at the level of 169 million tons in terms of content nutrients, which is 3% higher than in 2006.
The world mineral fertilizer industry is characterized by a number of features:
direct dependence of production on the availability and regularity of supplies of raw materials: natural gas, coal, naphtha (for the production of nitrogen fertilizers), phosphates (for the production of phosphorus fertilizers) and potassium salts (for the production of potash fertilizers),
capital intensive production,
concentration of industries near sources of raw materials (for example, a potash fertilizer plant) or sales markets,
the trend of building enterprises with a large unit capacity in order to reduce the cost of production per unit finished products,
a significant share of exports in the global production of mineral fertilizers (potassium chloride - about 80%, phosphorus fertilizers (monoammonium phosphate and diammonium phosphate) - more than 40%, ammonium nitrate - more than 25%, urea - about 23%) due to uneven geographical distribution natural resources in countries and regions of the world.
Today, the largest producers of mineral fertilizers in the world are China, which controls 21% of the market, the USA (13%), India (10%), Russia (8%) and Canada (8%). V last years US influence on the global fertilizer market is declining. Since 2006 the most great indicators growth is demonstrated by the markets of countries South-East Asia and Latin America.
As noted above, the centers for the production of phosphate and nitrogen fertilizers are distributed in areas of consumption, and potash - in areas where raw materials are extracted. In accordance with this, today the largest producers of nitrogen and phosphorus-containing fertilizers are regions and consumer countries - Asia (China and India) and North America(USA), and the producers of potash fertilizers are the countries with the raw materials: Canada, Russia and Belarus.
O high degree concentration of production of mineral fertilizers and their raw materials is evidenced by the fact that 15 countries account for almost 80% of the world's total production of ammonia, which goes to the production of nitrogen fertilizers. 85% of the world production of phosphorus is concentrated in 7 countries. More than 85% of the global volume of potassium chloride is produced in 6 countries.
The peculiarities of the location of capacities for the production of mineral fertilizers determine their commodity flows in the world market. In particular, if nitrogen fertilizers are exported, depending on the type, on average about 25-40% of world production, phosphorus - 35-50%, then potash - 80%. In terms of 100% nutrient, the share of potash fertilizers in world fertilizer exports is 60%.
For countries of Eastern Europe, including Russia, the situation is somewhat different from the global one, when most of the nitrogen fertilizers produced are not consumed, but exported. As a result, on this moment Eastern European countries are the largest exporters of nitrogen fertilizers. This is due to the fact that before the collapse of the USSR, this sector of production, which also worked for domestic consumption, ceased to be in demand within the country - the volume of fertilizer consumption decreased several dozen times. Therefore, the industry was forced to reorient itself to export.
The volume of international trade in mineral fertilizers and raw materials for their production is increasing every year. In 2005 alone, the volume of imports of ammonia, urea, diammonium phosphate and sulfur increased by 7%, 3%, 8% and 4%, respectively, against the 2004 level. This is due precisely to the fact that the geography of consumption and production of mineral fertilizers does not coincide. The most capacious and growing markets are deprived or insufficiently provided with their own production facilities.
In the last decade of the twentieth century, the world market for mineral fertilizers has become one of the most consolidated and highly competitive. V Western Europe 80% general production fertilizers are controlled by 8 large companies, in the USA 60% of nitrogen fertilizers are supplied by 5 companies. V developing countries fertilizer production is concentrated in the hands of a few state-owned or state-controlled companies. In Russia, up to 90% of potash and phosphate fertilizers are supplied by 6 companies, and the production of nitrogen fertilizers is controlled by OJSC Gazprom.
The largest supplier of mineral fertilizers to the world market is PotashCorp, followed by Mosaic. The top ten also includes Belaruskali, OCP, Agrium, Israel Chemicals, Yara, Uralkali, Silvinit. Other large manufacturers include Sinochem (China), IFFCO (India), Eurochem (Russia), Phosagro (Russia), SAFCO ( Saudi Arabia), Egyptian Fertilizer Company (EFC), Arab Fertilizer and Chemicals Company (AFCCO) (Egypt), Togliattiazot (Russia), Cherkassy (Ukraine) and Koch (USA).
Production volumes of mineral fertilizers by the largest producers
07.12.2014
The main features of the Russian fertilizer market are its monopolization and independence from imports, as well as its high export orientation. About 70% of the products manufactured in our country are supplied to the external market; Thus, the domestic fertilizer market, firstly, strongly depends on global trends, and secondly, it actively participates in the formation of the world market conjuncture.
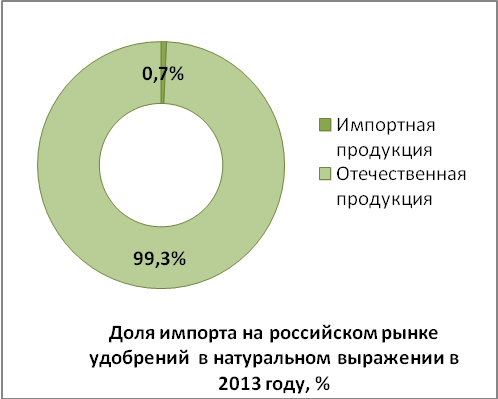
Chart 1. The share of imports on the Russian fertilizer market in in kind in 2013,%
For example, after Russia's Uralkali *, one of the world's largest fertilizer producers with a 23% market share (and a 43% share of the potash export market), abandoned joint trading with Belaruskali, world prices for potash fertilizers plummeted , the capitalization of world potash companies decreased. Each of the producers of this type of fertilizer tried to increase its market share, and for the first time in many years there was an oversupply, which led in 2013 to a decrease in Russian exports of potash fertilizers by 25.2%, while supplies of nitrogen and phosphorus fertilizers from Russia increased. The market share of the largest player also declined, but in 2014 Uralkali, having changed the strategy of “price-over-volume” to maximize profits, restored its historical market share.
* Revenue of OJSC Uralkali in the 1st half of 2014 increased by 7% compared to the 1st half of 2013 and amounted to USD 1,726 million. EBITDA decreased by 12% to USD 767 million, EBITDA margin decreased to 58%. Net profit decreased by 7% compared to the first half of 2013 and amounted to USD 370 million. OJSC Uralkali's production volume increased by 33% compared to the first half of 2013 and amounted to 6.0 million tonnes of potassium chloride. Sales volume increased 42% to 6.1 million tonnes of potassium chloride.
Currently, despite the stagnation of potash fertilizer prices at the beginning of 2014 ($ 350 per tonne), a decrease in the indicator is very likely, but the dynamics of potash prices will largely depend on the terms of the contract between Uralkali and China.
The decline in world prices for fertilizers in general led to a decrease in the profitability of the largest Russian fertilizer producers in 2013 - Phosagro, Acron *, Eurochem and Uralchem *. Prices for phosphate fertilizers decreased by 10% to $ 441 per ton, for urea - to $ 315 per ton, which was in line with the post-crisis level of 2010. And if sales of phosphate fertilizers were affected by the devaluation of the rupee and a decrease in demand for products in India, as well as a delay in consumption by domestic market USA, then the world prices for urea were negatively affected by the decrease in export duties in China.
According to our estimates, in 2014 urea prices will remain at the level of 2013, insignificant pressure on the indicator is possible only if large volumes export from China.
* Acron Group's revenue in the 1st half of 2014 increased by 4.3% compared to the 1st half of 2013 and amounted to RUB 35,746 million. EBITDA decreased by 2.6% to RUB 8,586 million, the EBITDA margin was 24% (this is 2 pp less than in the same period in 2013). Net profit amounted to RUB 6,550 million. (USD 187 million), which is 25% higher than in 2013. Net debt increased by 3% and amounted to RUB 37,891 million. (USD 1,127 million).
* The revenue of UCC Uralchem OJSC in the 1st half of 2014 decreased by 8.7% compared to the 1st half of 2013 and amounted to 36,536.9 million rubles. Adjusted EBITDA amounted to RUB 11.57 billion, that is, decreased by 17% compared to 2013. EBITDA margin for 6 months of 2014 amounted to 32% of revenue (this is 1 pp less than in the same period of 2013 .). Net profit amounted to RUB 1.23 billion. compared to 8.02 billion rubles. in the first half of 2013
The decrease in net and operating profit was due to the company's expenses on debt servicing, a sharp jump in the US dollar exchange rate in the first quarter of this year, as well as the forced shutdown of Voskresensk Mineral Fertilizers OJSC.
After falling prices on the potash fertilizers market and deteriorating prospects for the nitrogen fertilizers market due to the risk of reduced purchases by Indian companies and an increase in supplies from China, in 2014 investors turned their attention to the phosphate fertilizer market with great attention, as a result of which the quotes of shares of the largest producers of phosphate fertilizers during years have grown significantly. This dynamics is also explained by the expectation of a long-term increase in demand for phosphate fertilizers in India.
For example, Phosagro *, the world's fourth largest producer of phosphorus raw materials, has risen in price on the London Stock Exchange by almost a third over the year; however, it is still below the all-time high of April 2013. American Mosaic, the world's second largest producer of phosphate fertilizers and a major potash producer, gained 6.8%. For comparison, Uralkali lost 20% of its capitalization.
* Revenue of JSC Phosagro for the first 6 months of 2014 increased by 6% to RUB 56,702 million. compared to 53,715 million rubles. in the first half of 2013 due to an increase in sales of fertilizers by 4% and an increase in export earnings per tonne of DAP / MAP and NPK by more than 6 and 2%, respectively. EBITDA in the 1st half of 2014 amounted to 16,219 million rubles, which is 17% higher than in 2013. EBITDA margin was 29% compared to 26% in the 1st half of 2013. Net profit for the period increased by 70% and amounted to 8.1 billion rubles.
Fertilizer export
For the volume of Russian exports of fertilizers in kind in 2008–2014. multidirectional dynamics is characteristic; Thus, an increase in the indicator was recorded in 2010 and 2012, and in the crisis year of 2009, on the contrary, fertilizers were supplied to the external market by 3.5 million tons (or 14%) less than in 2008.
After the reduction in 2013 of the volume of supplies to other countries to 27.4 million tons, according to analysts of Intesco Research Group, in 2014 exports are expected to grow by about 1.8 million tons.

Graph 1. Dynamics of Russian exports of fertilizers in physical terms in 2008–2014 *, thousand tons
Source: Intesco Research Group
The leaders in the structure of export of fertilizers in physical terms are stably nitrogen fertilizers. Potash fertilizers account for about a quarter of the exported products. Phosphate fertilizers are exported no more than 0.05% of the total volume of exported domestic fertilizers.
The leading country in the import of Russian fertilizers is Brazil: in 2013, it imported about 5 million tons of products. Supplies to China decreased from 3.4 million tons in 2008 to 2.9 million tons in 2013. And 10.4% of domestic fertilizers were purchased by the United States.
Domestic market
The domestic fertilizer market is characterized by a low level of consumption. Currently, Russia uses about 38 kg of active ingredient per hectare of cultivated land, while the same figure in Europe and the United States is 130–140 kg. There are several reasons for underconsumption in the Russian market.
Firstly, this is due to genetic limitations inherent in the varieties of agricultural crops that are cultivated in Russia. That is, the use of fertilizers does not give the effect that is achieved when using them for European varieties. Moreover, varieties from European countries inapplicable in Russia, as they are designed for a warmer and milder climate.
Secondly, after Russia's accession to the WTO, subsidies for fertilizers to Russian agricultural producers were canceled: in such a situation, even the fall in world prices for potash fertilizers did not have a significant effect on farmers. The situation is aggravated by the absence of a system for providing cheap and long-term loans for domestic agricultural producers.
In 2009–2011 the volume of the Russian fertilizer market increased, reaching its maximum value- 12.6 million tons - in 2011. In 2012, there was a negative growth rate, and in absolute values the indicator decreased by 3.4 million tons. Such a significant decrease in the volume of the Russian market is explained by unfavorable natural conditions and, as a consequence, a decrease in demand for fertilizers in the country. However, in 2013, the indicator increased by one third, which is explained by the fall in prices for potash fertilizers in the world market and a decrease in the volume of exports of domestic fertilizers. The expected growth rate in 2014 is at the level of 2.5%.
Production
In the period 2009–2011. in Russia, there was an increase in the production of mineral fertilizers. In 2010, the output amounted to 37.2 million tons, which is 23% more than in the previous year. In 2011, the growth rate slowed down to 7%. Dry 2012 was the only one with negative value indicator. For the value 2013–2014. stagnation is characteristic; thus, according to Intesco Research Group estimates, the maximum volume of fertilizer production for the period under review will be achieved at the end of 2014 and will amount to 41.7 million tons of products.
Due to the specifics of the use of mineral fertilizers in agriculture the dynamics of their production volumes has a pronounced seasonal character. Basically, fertilizers are applied to the soil in spring or autumn, and their purchases are carried out in February – May or November – December. Smallest value fertilizer production is achieved in summer and late winter. The increase in production occurs in March and May, after which a period of production contraction begins in the summer months and early autumn. Further, there is a moderate increase in the volume of manufactured products until November-December, when the indicator reaches another peak. By February, the market will stabilize again and reach the level of the summer period.
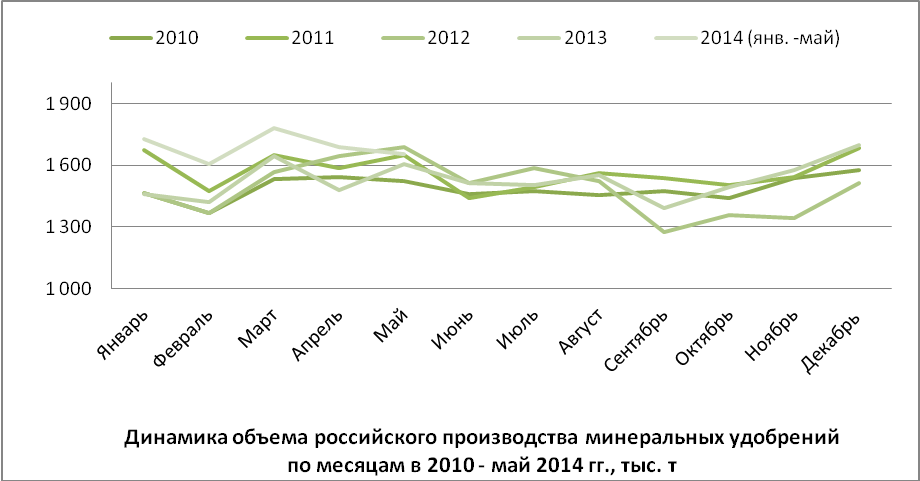
Graph 2. Volume dynamics Russian production mineral fertilizers by months in 2010 - May 2014, thousand tons
Fertilizer chemists make a significant contribution to the solution global problem providing the world's population with food. Russian manufacturers mineral fertilizers are actively involved in the global integration process, annually supplying millions of tons of nitrogen, phosphorus and potash fertilizers to various countries of the world.
In 2015, the volume of export supplies of mineral fertilizers amounted to 16 million tons, while the share of Russia was at the level: in the market of nitrogen fertilizers - 5.2%, phosphate fertilizers - 6.3%, potash fertilizers - 24.1%.
This article presents the main indicators of the development of the world mineral fertilizers market in 2015/16. and appraisal international organization IFA its balance in the medium term until 2020.
World consumption of fertilizers in 2015/16 amounted to 181 million tons (dry matter), i.e. due to the general economic recession and drought in some parts of the world (in South and Southeast Asia, Latin America and Africa) decreased by 1%. Nevertheless, the assessment of the market by specialists of the international organization IFA in 2016/17. looks rather optimistic: demand is expected to grow by 2.9% (Table 1). Some improvement in the economic situation and more favorable weather conditions are grounds for optimism.
Table 1. Fertilizer consumption in the world, thousand tons (p.w.)
|
Total |
||||
|
Rate of increase |
||||
|
Rate of increase |
||||
|
2016/17 (estimate) |
||||
|
Rate of increase |
A source:Fertilizer Outlook 2016-2020 , IFA.
In the medium term, until 2020, the mineral fertilizer market will show a moderate increase and, with capacity utilization at 80%, will reach 199 million tons (p.u.) (Table 2), or 270 million tons in physical volume. For the period 2016-2020 investments in the industry will amount to $ 130 billion; more than 150 new capacities will be commissioned, i.e. the global capacity will increase by more than 150 million tons.
table 2. Mid-term forecast for the development of mineral fertilizers production
in the world, thousand tons (dry matter)
|
Total |
||||
|
2020/21 (forecast) |
||||
|
Rate of increase |
A source:Fertilizer Outlook 2015-2019, IFA.
The main growth in demand for fertilizers will occur in Africa (3.6%), South Asia (2.9%), Latin America (2.8%), primarily in Brazil and Argentina.
Production capacity ammonia by 2020 will increase by 10% compared to 2010. - up to 230 million tons of NH 3. The main capacities will be commissioned in China, Indonesia, USA, Algeria, Egypt and Nigeria. The increase in ammonia production capacity is determined by the expansion of the production base for the production of urea, which accounts for 55% of the nitrogen fertilizer market.
Over the next five years, 97% of the planned ammonia production capacity will operate at natural gas although in China, despite the rationalization of production, 78% of the capacity will still use coal (currently, 82% of ammonia plants use this raw material).
Global intake power urea for the period 2015 - 2020 will increase by 10% - up to 229 million tons. Approximately 35% of new projects will be implemented in East Asia, 18% - in Africa and 15% in North America. A total of 60 new projects for the production of urea are expected to be commissioned, of which 20 will be launched in China.
The demand for urea in 2020 is estimated at 208 million tons, i.e. will grow by 2.5% annually, with growth in industrial demand more than four times the growth in demand from the fertilizer sector. The main demand for industrial urea is expected in China and Europe, for urea fertilizer - in the South Asian region.
With the predicted development parameters of the world urea market, capacity utilization as a whole will amount to 90%, i.e. the market will be balanced.
On the market phosphate raw materials supply is expected to increase by 11% - up to 250 million tons, while 80% of the increase in volume of 35 million tons will be due to the expansion of the production base in Morocco, Saudi Arabia, Jordan and China.
Global output capacity phosphoric acid for the period 2015 - 2020 will increase by 13% - up to 65.3 million tons due to the commissioning of 30 new productions, with ¾ of them in China. In addition, new projects will be implemented in Morocco, Saudi Arabia and Brazil. By 2020, the demand for phosphoric acid will grow by 2.5% per year.
In the period 2015 - 2020 30 new production capacities are expected to be commissioned phosphate fertilizers , as a result of which the world capacity will increase by 7 million tons (d.h.) - up to 52 million tons (dry matter). About half of the new capacities will be commissioned in China and Morocco. In addition, new projects will be implemented in Saudi Arabia, Brazil and India.
Market potash fertilizers , which showed the greatest dynamism in previous years, in 2015 - 2020 will continue to develop actively: the implementation of 25 projects is expected, of which four are large greenfield - in Canada, Russia and Belarus. The world capacity for the production of potash fertilizers in 2020 is estimated at 64.5 million tons (dry matter), i.e. will increase relative to 2015 by 22%.
The demand for potash fertilizers in 2020 is expected to reach 51.6 million tons, i.e. will increase by 2.1% per year, and the capacity utilization will be at the level of 80%.
Production sulfur in the world in 2020 is expected at the level of 72 million tons (p.w.), i.e. will increase annually by 4%. Major projects will be implemented in Qatar, Russia, Saudi Arabia and Turkmenistan. The US is also expected to increase sulfur production, which will lead to a decrease in its imports.
Sulfur supply / demand in 2020 will amount to 69 million tons (p.u.), i.e. capacities will be loaded by 96%, which is determined by an increase in demand from sulfuric acid producers.
Table 3 regions are represented - exporters of the main types of mineral fertilizers in 2014. It follows from it that the share of the CIS countries in the world market of ammonia was at the level of 24%, urea - at the level of 16%, ammonium nitrate - at the level of 63% (monopoly position), DAF - at the level 10% and potash fertilizers - at the level of 40%.
Table 3. Export volumes of the main types of mineral fertilizers by region
in 2014, thousand tons (r.h.)
|
Ammonia |
Urea |
Ammonium nitrate |
Potassium chloride |
||
|
Western Europe |
|||||
|
Central Europe |
|||||
|
CIS (with Ukraine) |
|||||
|
North America |
|||||
|
Western asia |
|||||
|
The world, everything |
Source:IFA, 2015.
Table 4 shows the regional sales markets for the main types of mineral fertilizers, which have significant differences in capacity. So, the most capacious sales markets are:
- for ammonia - the countries of North America (USA) and the EU;
- for urea - North America (USA), Latin America (Brazil), South Asia (India) and EU countries;
- for ammonium nitrate - the countries of Latin America;
- for DAF - South Asian countries (India), EU countries;
- for potassium chloride - countries of East Asia (China), Latin America, North America (USA) and EU countries.
Table 4.Volumes of imports of the main types of mineral fertilizers by region in 2014, thousand tons (p.v.)
|
Ammonia |
Urea |
Ammonium nitrate |
Potassium chloride |
||
|
Western Europe |
|||||
|
Central Europe |
|||||
|
CIS (with Ukraine) |
|||||
|
North America |
|||||
|
Latin America |
|||||
|
Western asia |
|||||
|
South asia |
|||||
|
East Asia |
|||||
|
The world, everything |
The market for mineral fertilizers is one of the few highly competitive world markets in which Russia participates as a full-fledged player, occupying leading places and influencing the general market.
The total world production of mineral fertilizers is characterized by a slow but stable annual growth. In 2010, the world produced about 183 million tons of all types of mineral fertilizers. On average, production grew by 3-4% per year, with the only exception being 2009.
According to the Academy of Economic Research industrial markets, the largest producers of mineral fertilizers in the world are China, which controls 21% of the market, the USA (13%), India (10%), Russia (8%) and Canada (8%). In recent years, the influence of the United States on the world fertilizer market has been declining, but the influence of the countries of Southeast Asia and Latin America is growing.
The largest supplier of mineral fertilizers to the world market is PotashCorp, followed by Mosaic. The top ten also includes Belaruskali, OCP, Agrium, Israel Chemicals, Yara, Uralkali, Silvinit. Other major manufacturers include Sinochem (China), IFFCO (India), Eurochem (Russia), Phosagro (Russia), SAFCO (Saudi Arabia), Egyptian Fertilizer Company (EFC), Arab Fertilizer and Chemicals Company (AFCCO) (Egypt), Togliattiazot (Russia), Cherkassy (Ukraine) and Koch (USA).
In the last decade of the twentieth century. the world market of mineral fertilizers has become one of the most consolidated and highly competitive. This is not surprising since fertilizer production is capital intensive. In Western Europe, 80% of the total fertilizer production is controlled by 8 large companies, in the USA 60% of nitrogen fertilizers are supplied by 5 companies. In developing countries, fertilizer production is concentrated in the hands of a few state-owned or state-controlled companies. In Russia today, 50% of all types of fertilizers are produced by 4-5 companies.
Manufacturing and manufacturers
The Russian chemical industry has about 40 manufacturers of various mineral fertilizers. Complex (or complex) fertilizers - nitrogen-phosphorus, nitrogen-potassium-phosphorus, etc., account for about 60% of the total volume of fertilizers produced. The remaining 40% are supplied to the market as one-component - nitrogen, potash or phosphorus. Most of of the market for single-component fertilizers (more than 50%) falls on potash. Almost 50% of the original fertilizers produced in Russia are nitrogen, 30% are potash and 20% are phosphorus.
Tab. 1. Leading producers of mineral fertilizers and total output by type in 2009
|
Company |
Region |
Production in 2009 |
||||||
|
Nitrogen |
Phosphoric |
Potash |
Liquid |
Complex |
Total |
|||
|
JSC "Silvinit" | ||||||||
|
OJSC Uralkali |
Perm Territory | |||||||
|
JSC "Ammophos" |
Vologodskaya Oblast | |||||||
|
OJSC "Acron" |
Novgorod region | |||||||
|
JSC "Nevinnomyssky Azot" |
Stavropol region | |||||||
|
Novomoskovskaya joint-stock company OJSC "Azot" | ||||||||
|
JSC "Balakovo Mineral Fertilizers" |
Saratov region | |||||||
|
OJSC "Minudobreniya" |
Voronezh region | |||||||
|
OJSC "Azot" |
Perm Territory | |||||||
|
Kemerovo OJSC "Azot" |
Kemerovo | |||||||
|
OJSC "Dorogobuzh" |
Smolensk region |
| ||||||
|
JSC "ZMU KChKhK" |
Kirov region | |||||||
|
OJSC "Kuibyshevazot" | ||||||||
|
LLC "Industrial Group" Phosphorite " | ||||||||
|
OJSC "Togliattiazot" |
Samara Region | |||||||
|
JSC " Mineral fertilizers» |
Perm Territory | |||||||
|
JSC "Salavatnefteorgsintez" |
Bashkortostan | |||||||
|
LLC "Agro-Cherepovets" |
Vologodskaya Oblast | |||||||
|
Moscow region | ||||||||
|
LLC "EuroChem-Belorechensk Mineral Fertilizers" | ||||||||
|
Other enterprises | ||||||||
Source: ABARUS Market Research according to the Federal State Statistics Service of the Russian Federation.
Territorial distribution of production
The peculiarities of the fertilizer production technology are such that the production of phosphate and nitrogen fertilizers is usually concentrated closer to the regions of sale, and potash - to the regions of raw material extraction. Russian geographic distribution fertilizer production has clear leaders. Almost 40% is taken by the Perm Territory, where the two largest producers of potash fertilizers are located - the Silvinit and Uralkali companies, which promise to become a single whole in 2011, as well as Azot OJSC. Another, slightly less impressive share of 11% falls on Vologda region... OJSC "Ammophos" and LLC "Agro-Cherepovets" are located there.
Rice. 1. Distribution of the output of mineral fertilizers in the RF by districts, 2010,%.
Thus, it turns out that more than half of the production of all fertilizers in Russia is distributed between five participants, two of which in the very near future may form one company: JSC Silvinit intends before the expiration of the II quarter. In 2011, to include in its structure Uralkali, which produces almost one and a half times less than its "absorber", but is itself a giant of the domestic chemical industry. OJSC Silvinit produces 45% of the total volume of potash fertilizers, and OJSC Uralkali - about 35% (in separate years Uralkali's share exceeded the volumes of Silvinit, its main competitor and now a partner). Thus, the weight of these two enterprises accounts for 90% of the total production of potash fertilizers in the country.
The remaining 50% goes to the Stavropol Territory, Novgorod, Tula, Saratov, Samara, Voronezh, Kemerovo, Kirov, Smolensk, Leningrad and other regions Russian Federation... The leading players in each of these areas are quite recognizable. These are Akron OJSC (Novgorod Region), Nevinnomyssky Azot OJSC (Stavropol Territory), Novomoskovsk Joint-Stock Company Azot OJSC (Tula Region), Balakovsk Mineral Fertilizers OJSC (Saratov Region), Minudobreniya OJSC (Voronezh Region) ), Kemerovo OJSC Azot, Smolensk OJSC Dorogobuzh, OJSC Mineral Fertilizers Plant of the Kirovo-Chepetsk Chemical Combine, etc. All of these enterprises produce more than 500 thousand tons of fertilizers per year.
Fertilizer production in Russia
The production of nitrogen fertilizers in Russia demonstrates enviable stability, but at the same time low growth rates - nitrogen fertilizers are added annually by 5-6% per year on average. However, this moderation served good service during the crisis - in 2009, the decline was only 6%, which were quickly returned to next year... It should be noted right away that absolutely all types of mineral fertilizers quickly restored their quantitative volume immediately after the crisis, regardless of how much was “lost” in 2009, and some even increased it in relation to the pre-crisis period.
Rice. 2. Dynamics of the production of nitrogen fertilizers in the Russian Federation, 1998-2010, thousand tons and%. 
Source: ABARUS Market Research according to the Federal State Statistics Service of the Russian Federation.
The production of phosphate fertilizers is increasing at a similar rate as the production of nitrogen fertilizers - about 5-6% annually. At the same time, the quantitative volume of output is more than two times less. In 2009, the decline in the phosphate fertilizer segment was 8%, and a 20% positive increase in 2010 led to the release of maximum amount phosphate fertilizers for the entire period under consideration - more than 3 million tons.
Rice. 3. Dynamics of the production of phosphate fertilizers in the RF, 1998-2010, thousand tons and%. 
Source: ABARUS Market Research according to the Federal State Statistics Service of the Russian Federation.
Rice. 4. Dynamics of the production of potash fertilizers in the RF, 1998-2010, thousand tons and%. 
Source: ABARUS Market Research according to the Federal State Statistics Service of the Russian Federation.
Potash production is subject to more dramatic fluctuations than in the two segments described above, but the annual average growth is higher here - almost 8%. In 2009, the segment of potash fertilizers experienced the strongest drop among all types of mineral fertilizers - by more than 30%. But during 2010, the lost volume was almost completely restored.
The ratio of production between these three types of fertilizers is practically unchanged - the production of phosphorus fertilizers is less than half of the volume of other fertilizers: both nitrogen and potash. At the same time, the output of nitrogen fertilizers slightly exceeds the output of potash. The only exceptions are 2005, when potash production was slightly higher, as well as 2009, when a significant decline occurred in the segment of potash fertilizers, which disrupted the usual production pattern. In 2010, the balance of power returned to normal.
Rice. 5. Comparative dynamics of the output of the main types of fertilizers in the Russian Federation, 2003-2010, thousand tons. 
Source: ABARUS Market Research according to the Federal State Statistics Service of the Russian Federation.
Fertilizer export
The Russian mineral fertilizer market is characterized by a pronounced export orientation. This is due to the fact that before the collapse of the USSR, this sector of production, which worked for domestic consumption, ceased to be in demand within the country - the volume of fertilizer consumption decreased several dozen times. Therefore, the industry has been reoriented towards export.
Annual average export growth rates are almost completely correlated with production growth, and before the crisis it was about 6%. Although in some periods there were slight declines of 2-4% (for example, in 2002 and 2006). The crisis situation began to affect the export of fertilizers as early as 2008, when supplies decreased by 7.4%. In 2009, the decline continued: -14.4% of the volume of 2008, but in 2010, exports showed an unprecedented increase - by 27%. As a result, last year, 27.1 million tons of Russian-made fertilizers in absolute weight were sent abroad, or 12.3 million tons in terms of 100% of nutrients. This is 68.7% of the total volume of fertilizers produced in Russia in 2010.
At present, more than 38% of all exports are nitrogen fertilizers, almost 34% are potash fertilizers and 28% are complex fertilizers. This ratio within exports was not always the case. In 2000, nitrogen fertilizers accounted for over 45%, while potash fertilizers accounted for just over 20%. Over the past period, the export potential of potash fertilizers has significantly increased, not counting the failure that happened in 2009, which was associated with a sharp drop in production.
Rice. 6. Percentage distribution of types of fertilizers exported from Russia, 2010,%.